Colorado Faces Winter Urban Firestorm
Jan 3, 2022
On December 30, 2021, high winds roared out of the west and down the front slope of the Rocky Mountains in Colorado. Northwest of Denver, peak gusts reached 115 miles (185 kilometers) per hour—the equivalent of a category 3 hurricane. Those winds whipped up intense grass and brush fires in south Boulder and blew them east toward the towns of Superior and Louisville, igniting a firestorm. By the time it was over, nearly 1,100 houses had been destroyed or damaged, two people were reported missing, and thousands were displaced.
The Marshall fire is now the most destructive in the state’s history. Four of the top five largest wildfires on record in Colorado occurred between 2018 and 2021.
Unlike many of the megafires in the American West in recent years—which typically occur in forests and wildlands—the Marshall fire quickly travelled into densely populated neighborhoods and transitioned from a wildfire to an urban conflagration.
Tens of thousands of residents were evacuated as flames were blown down streets and through cul-de-sacs. The fire was carried by what climate scientist and Boulder resident Daniel Swain called an “ember storm.” Blown by hurricane-force winds, the embers leapt from house to house, burning many from the inside out, while torching trees, igniting commercial buildings, and jumping a highway.
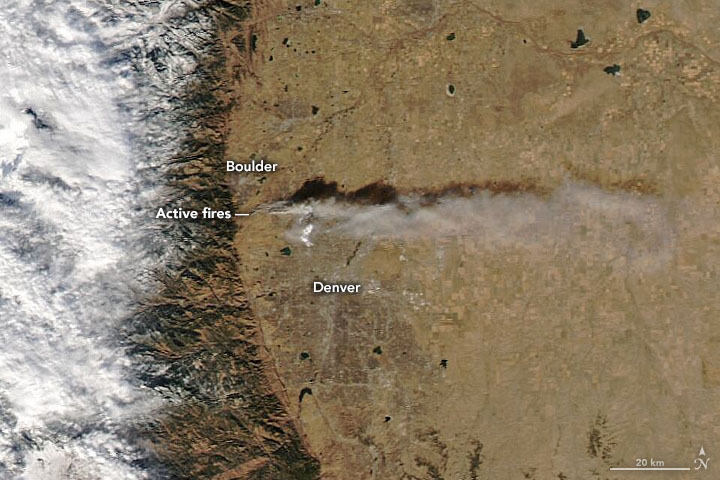
The natural-color image above was acquired just a few hours after the fire started on December 30 by the Moderate Resolution Imaging Spectroradiometer (MODIS) on NASA’s Aqua satellite. At the time, the smoke plume—which was also visible on radar—stretched about 60 miles (100 kilometers) over Colorado’s eastern plains. The fire also generated its own weather: the rising heat created a low-pressure area that drew surface winds toward the fire from all directions.
The next day brought much-needed moisture, as a cold front moved in and dropped more than 10 inches (25 centimeters) of snow—dampening the fire but also complicating the response. As of January 3, 2022, the perimeter of the 6,200-acre fire was fully contained.
High winds and wildfires are not uncommon on the Front Range, but a December wildfire is; the normal fire season lasts from May to September. One recent study found that increases in extreme fire weather are being driven by decreases in atmospheric humidity and increasing temperatures.
In 2021, Colorado saw an unseasonably warm summer and fall, coupled with record dryness. The warm, dry spell followed an unusually wet spring, which reduced wildfires through the summer and fueled the growth of vegetation—which then dried out and provided ample tinder for the December fire.
At the time of the fire, the eastern part of Boulder County was classified with extreme drought, according to the U.S. Drought Monitor. “While drought is a fairly common occurrence, it is pretty rare to have an increasing severity of drought in the fall and into winter,” said Becky Bolinger, Colorado assistant state climatologist. “Typically, droughts increase in intensity in the spring and summer. So, in that sense, this one is pretty notable.”
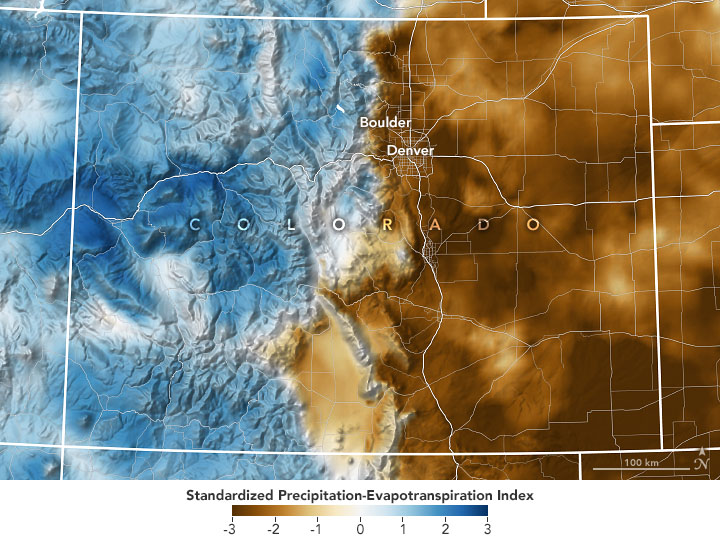
The map above shows the Standardized Precipitation-Evapotranspiration Index (SPEI) for Colorado for the month of December 2021. It accounts for both precipitation and temperature, showing the extreme warm and dry conditions across eastern Colorado. (It does not include the New Year’s snowfall that helped extinguish the fire.)
According to the Colorado Climate Center, SPEI values exceeding minus 2 are very rare. Each numeral is one standard deviation away from normal. “So, minus 2 is two standard deviations drier and is extreme,” said Bolinger.
The map also shows the contrast between the extreme drought in the eastern part of the state, where the fire occurred, and the snowpack in the western part of the state, where significant December snowfalls brought the snowpack near or above average. Denver, which normally has 30 inches of snow by late December, did not record its first winter snowfall until December 10, the latest on record.
NASA Earth Observatory images by Joshua Stevens, using MODIS data from NASA EOSDIS LANCE and GIBS/Worldview, and PRISM data courtesy of the West Wide Drought Tracker. Text by Sara E. Pratt.

