Western Soils and Plants are Parched
Jun 11, 2021
For the second year in a row, drought has parched much of the United States from the Rocky Mountains to the Pacific Coast. Following one of the planet’s warmest years on record, and with precipitation this year well below average in the western U.S., scientists and government agencies are watching for diminished water resources and potentially severe fire seasons.
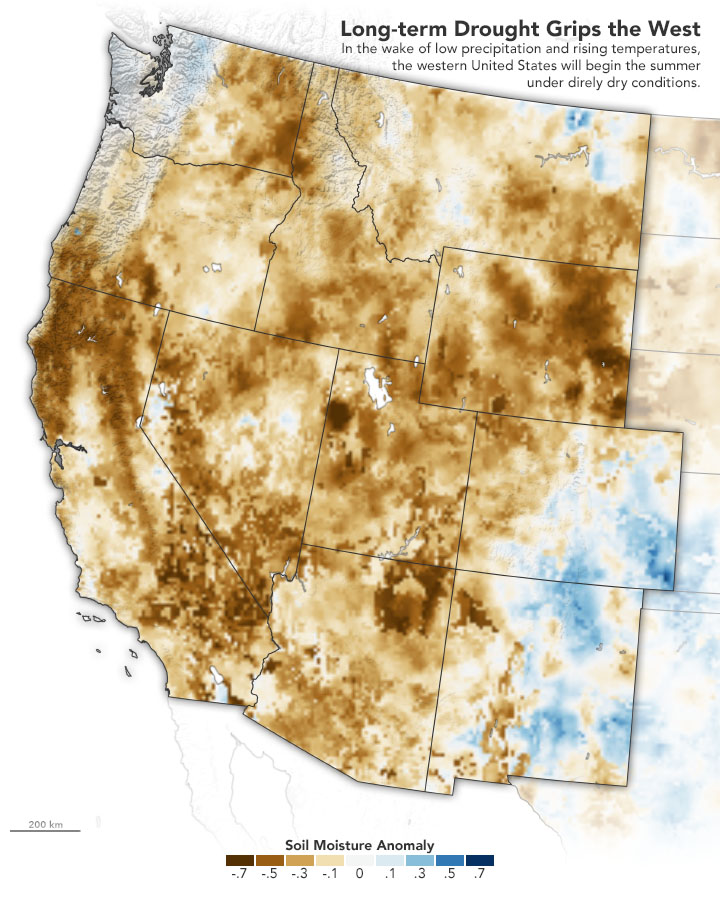
According to the June 10 report from the U.S. Drought Monitor, 88.5 percent of the land area in the West—defined as California, Nevada, Arizona, New Mexico, Utah, Idaho, Montana, Oregon, and Washington—is experiencing some level of drought, with 55 percent being classified as “extreme.” An estimated 90 percent of Utah is under extreme drought conditions, with 64 percent rated “exceptional” (the worst classification). Similar conditions are reported across Arizona (87 percent extreme), California (85 percent), and Nevada (76 percent). More than 58 million people are living with the dry conditions in the region.
The map above offers one indicator of the conditions on June 5, 2021. Using data from the Crop Condition and Soil Moisture Analytics (Crop-CASMA) product, the map shows soil moisture anomalies, or how the water content in the top meter (3 feet) of soil compares to normal conditions for the time of year. Crop-CASMA integrates measurements from NASA’s Soil Moisture Active Passive (SMAP) satellite and vegetation indices from the Moderate Resolution Imaging Spectroradiometer (MODIS) instruments on NASA’s Terra and Aqua satellites.
Released in April 2021, the Crop-CASMA portal offers soil moisture information more frequently (every 2 to 3 days) and on smaller scales (down to the level of towns and counties instead of states) than many other data products. Farmers and resource managers can use soil moisture data to help time crop planting and irrigation, to forecast yields, and to track droughts and floods. The product was developed by scientists at the U.S. Department of Agriculture (USDA), George Mason University, and NASA’s Goddard Space Flight Center and Jet Propulsion Laboratory. One of the primary users of the dataset is the USDA’s National Agricultural Statistics Service.
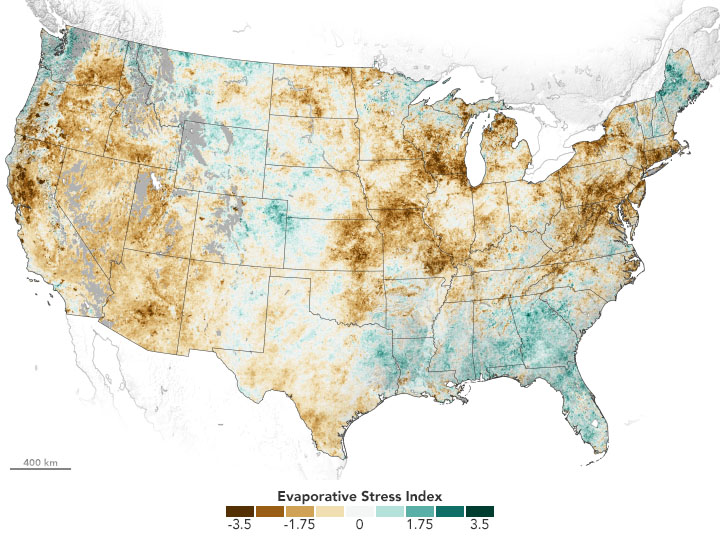
The second map provides a measure of the health of vegetation from March 5 to May 28, 2021. The Evaporative Stress Index (ESI) depicts the level of evapotranspiration, or how much and how quickly water is evaporating from the land surface and from the leaves of plants. Measuring evapotranspiration is useful because negative levels can indicate that plants are facing stress even if leaves have not yet wilted or turned brown. ESI data is derived from observations of land surface temperatures from NOAA’s geostationary satellites and of leaf area index from Terra and Aqua. ESI is considered particularly useful for observing “flash drought” and agricultural drought.
In recent years, NASA has redoubled its efforts to make satellite data more accessible and applicable to partners at other federal and state water and agriculture agencies. One of those efforts is the Western Water Applications Office, which is connecting scientists and engineers with farmers, reservoir managers, and other decision-makers to improve the forecasting of water availability, the management of water resources, and the adaptation to and mitigation of drought.
Drought conditions in the West are likely to get worse in 2021. The most recent NOAA Climate Prediction Center forecast noted: “Short-term and long-term drought remains entrenched throughout a majority of the West…The Southwest is typically dry during June until monsoon rainfall begins later in July. Based on below-normal precipitation during the past 30 to 60 days, low soil moisture conditions, and elevated monthly and seasonal probabilities of near to below normal precipitation and above normal temperatures for June-July-August, drought is expected to persist over the south-central West and to expand northward across parts of the Pacific Northwest and northern Rockies.”
NASA Earth Observatory images by Joshua Stevens, using soil moisture data from Crop Condition and Soil Moisture Analytics (Crop-CASMA) and evaporative stress index data from SERVIR. Story by Michael Carlowicz.

